
Overeview
In this short article I will discuss this relatively new Azure service that provides a managed instance of Prometheus and Grafana to monitor AKS clusters.
Traditionally platform engineers install and set up Prometheus on the clusters they’d like to monitor by using helm on it’s own namespace then set up all the Prometheus collector and alerting infrastructure. With the new managed Prometheus service, Azure has made it easy to install and configure this service which can easily be integrated with Azure monitor.
It is important to note that Azure by default provides metrics for the AKS clusters but these are by no means as comprehensive as what Prometheus provides.
Let’s Get Started
We are going to enable the managed Prometheus service on an existing AKS cluster we previously created.
The first and only prerequisite to creating a Managed Prometheus instance is Azure Monitor workspace.
Create an Azure Monitor Workspace in your chose subscription and resource group:
There are a few options to enable the service but I’ve chose azure CLI method. You can run the following command to enable the service on your specific AKS cluster.
az aks update --enable-azure-monitor-metrics -n [cluster-name] -g [cluster-resource-group] --azure-monitor-workspace-resource-id [workspace-name-resource-id]
After creating the monitor workspace, you can find the resource id the properties menu which will be used in the command above.
In my case the command is simply
az aks update --enable-azure-monitor-metrics -n Test_WebApp -g Amir_Test --azure-monitor-workspace-resource-id '/subscriptions/[removed]/resourcegroups/amir_test/providers/microsoft.monitor/accounts/amir-prometheus-worspace'
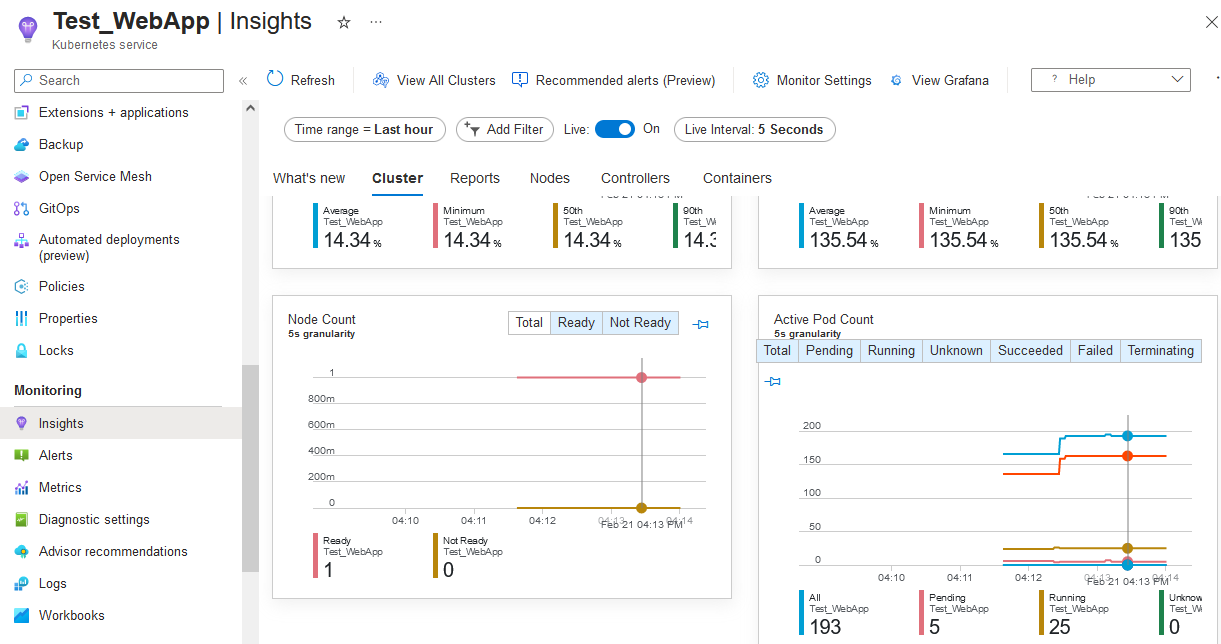
After the command operation has completed, we can immediately revisit our AKS cluster and check the ‘Insights‘ section. We can see the managed Prometheus is now showing as ‘Enabled‘.

Data will eventually start populating after a period of time. Once the data is flowing in, we can also enable ‘live‘ mode to see the metrics live.
From here you also have the options to enable Grafana and Container Insights.
to enable Grafana select ‘Configure monitoring’ and select ‘Enable Grafana’
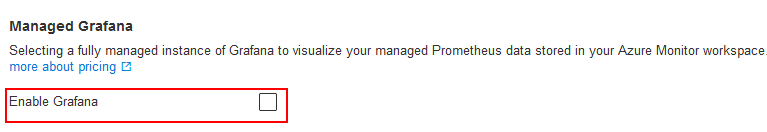
This option will kick off a deployment that will also add the Grafana Managed service with a URL to access Grafana interface.
Create Rule Groups with Azure Monitor
One of the perks of using the managed Prometheus instance is the ability to instantly integrate it with Azure monitor. This option makes it easy to create alert rules for various metrics.
We can see the option for Prometheus rule groups in Azure Monitor

If we click on the rule groups we can see the deployment of the Prometheus Managed Instance has automatically created several recording rules for our cluster. These rules record the metrics and are also used to present graphs within the insights section.

One of the rule groups contains rule for collecting node metrics whereas the other one contains rules for pods and workloads.
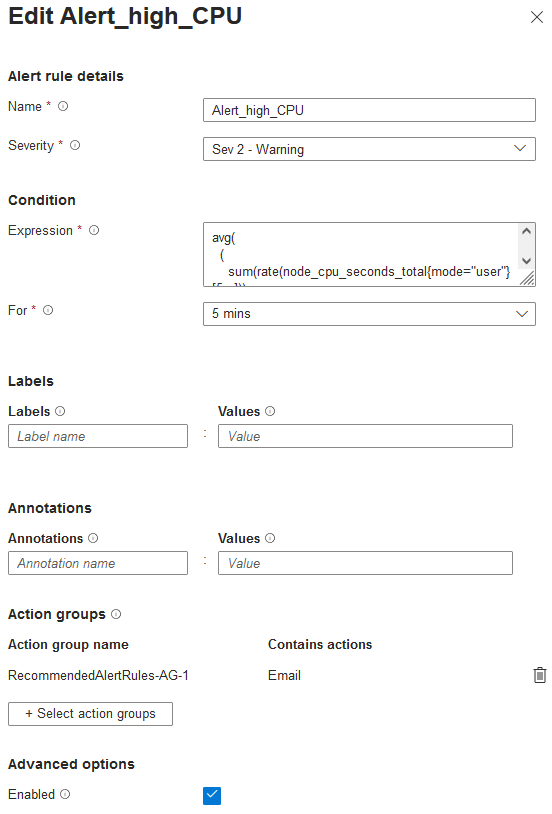
We can also create our own ‘Alert rules‘ based on specific metrics using PromQL expressions.
For instance, I created the alert rule below to send an email in case any node CPU consumption runs at 90% threshold for longer than 5 minutes.
Final Words
To keep this article short I mostly avoided getting too much into details with definitions and step by step guides. It also helps that these services are generally relatively straightforward to set up for an experience cloud engineer.
If there would be a challenge here, I would say it’s in setting up comprehensive and useful alerts using PromQL after the solution is set up and in place.
Anyways, thanks stopping by and reading this article,hopefully you found something useful here.

You must be logged in to post a comment.